


The fact that BTC has fallen below the mining cost does not necessarily mean that miners will immediately engage in panic selling. According to Checkonchain’s difficulty regression model, as of March 13, 2026, the average production cost of Bitcoin was approximately $88,000, while the spot price was approximately $69,200. a gap of nearly $19,000, meaning that on average, miners lose approximately 21% for every Bitcoin mined. However, behind this “loss” figure lie two entirely different cost lines—cash cost and total cost—and most of the market’s panic narratives about “miners about to sell” are based on a confusion between these two lines. This article will break down how these two metrics actually work and use the latest on-chain data from 2026 to illustrate where miners’ true sell-off threshold lies.
Why isn't the cost of mining a single number?
Most investors assume that “mining costs” are a fixed threshold, and falling below it means miners are operating at a loss across the board. However, according to CoinShares’ Q1 2026 mining report, miners operating mid-generation hardware (S19j Pro-class, with an energy efficiency of approximately 29.5 J/TH) and and an average industrial electricity rate of $0.05 per kWh were already operating below the breakeven point by the end of 2025, and this situation only worsened in 2026. This illustrates that “cost” itself varies greatly among different miners and is not a single, uniform figure.
What is the difference between cash cost and full cost?
Cash costs include only immediate operating expenses such as electricity, labor, and maintenance; total costs additionally include non-cash expenses such as equipment depreciation and equity-based compensation. According to an analysis by TechFlow compiled by Dongqu Dongqu, Marathon Digital, the world’s largest publicly traded mining company, had an average energy cost of $39,235 per Bitcoin mined in the third quarter of 2025, while the second-largest publicly traded mining company, Riot Platforms, had a cost of $46,324. However, these mining companies must also factor in non-cash expenses; once depreciation, impairment, and stock option compensation are included, the total cost of mining a single Bitcoin can easily exceed $100,000.
Why is this distinction crucial for assessing selling pressure?
As long as cash flow remains positive, miners will continue mining, even if they are showing a loss on paper when calculated on a full-cost basis. This means that the widely held narrative that “falling below the break-even point = miners must sell” actually overlooks the fact that miners can continue operating for quite some time while experiencing “accounting losses” but maintaining “healthy cash flow,” without needing to immediately sell off their Bitcoin holdings.
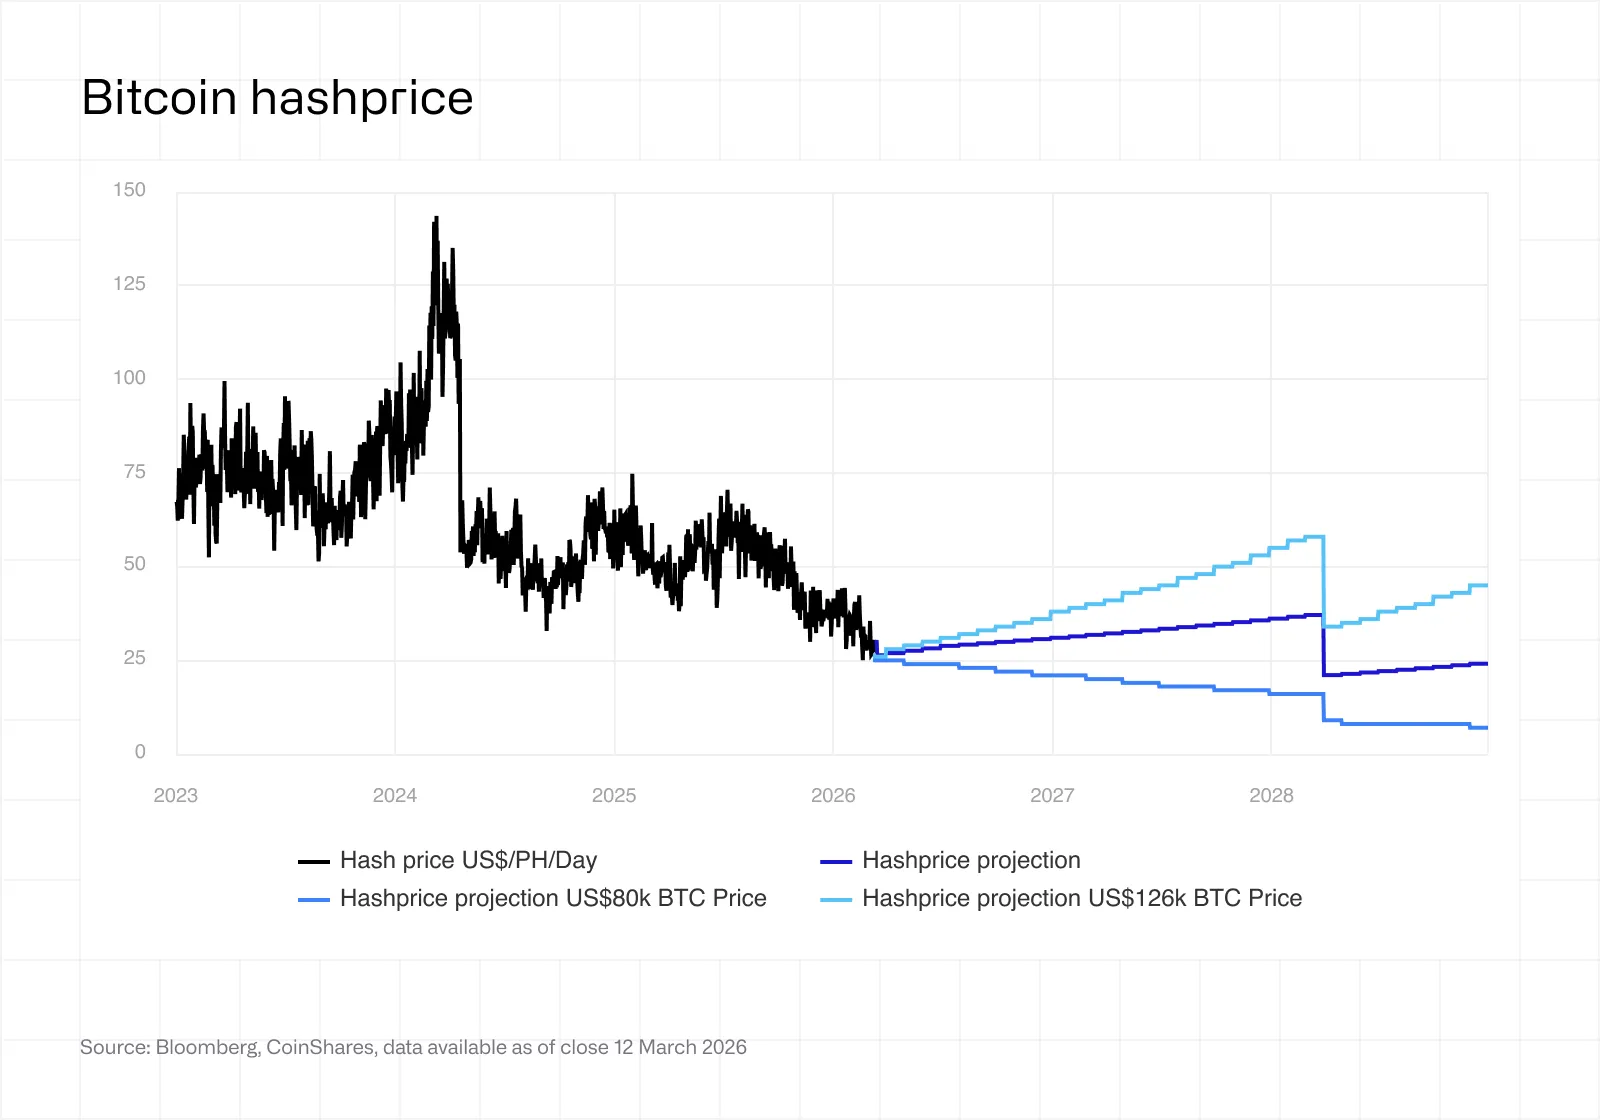
According to CoinShares’ Q1 2026 report, the hash price has fallen to $29 per PH/s per day, a only slight rebound from February’s low of $28. This level is already below the break-even point for most mid-generation hardware. Meanwhile, Bitcoin has experienced three consecutive downward difficulty adjustments—the first such streak since July 2022—which is typically seen as a sign of miner capitulation.
The hash price is the actual daily revenue miners earn per unit of hashrate, calculated based on a combination of block rewards and transaction fees. When the hash price falls below the electricity cost threshold for mining rigs, even highly efficient rigs struggle to remain profitable. This explains why the consecutive difficulty adjustments in early 2026 were interpreted by the market as a sign of structural pressure, rather than merely short-term volatility.
What does the continuous reduction in difficulty mean?
The direct cause of a difficulty adjustment is the loss of hash rate from the network, which is typically due to high-cost miners being forced to shut down. According to a June 2026 report by Cointelegraph, Charles Edwards, founder of the quantitative Bitcoin fund Capriole Investments, noted that Bitcoin is trading near its production cost, with miners’ average profit margin at only about 4.67%—close to a two-year low.
“Bitcoin is trading back at its production cost. On average, miners are now just breaking even.”
— @caprioleio, X Post
Edwards further pointed out that, historically, the “best long-term value entry range” has typically fallen between production costs and electricity costs. This means that even if miners’ profit margins are extremely low, as long as the price does not fall below the lower threshold of electricity costs, miners still have an economic incentive to continue operating rather than immediately liquidate their holdings.
Will Miners Really Panic-Sell? Divergent Views in the Market
In a June 2026 post on X, a trader going by the pseudonym Killa presented a bullish argument based on the relationship between price and difficulty:
“You’re literally seeing miners capitulate—a signal that has historically marked the perfect time to accumulate. There isn’t a clearer sign to start accumulating $BTC.”
— @KillaXBT, X Post
The logical basis for this argument is that, historically, miner capitulation has often been accompanied by new demand entering the market at low prices, with both factors together signaling a market bottom. However, an analysis published by crypto.news in 2026 raised concerns from a different perspective: The current round of pressure on miners is accompanied by heavy debt, record outflows from ETFs, and even Strategy—long regarded as Bitcoin’s largest institutional buyer—has turned into a seller, meaning that the key historical condition of “demand stepping in to catch the fall” is clearly absent this time around.
In other words, Killa’s optimistic argument is based on the historical pattern that “miners’ capitulation = the bottom,” while crypto.news’s cautious argument points out that this cycle lacks the necessary condition for that pattern to hold—simultaneous buying support from the demand side. Neither of these arguments is wrong; the difference lies in their differing assumptions about whether “this cycle is the same as in the past.”
What role are institutional ETFs playing in this cycle?
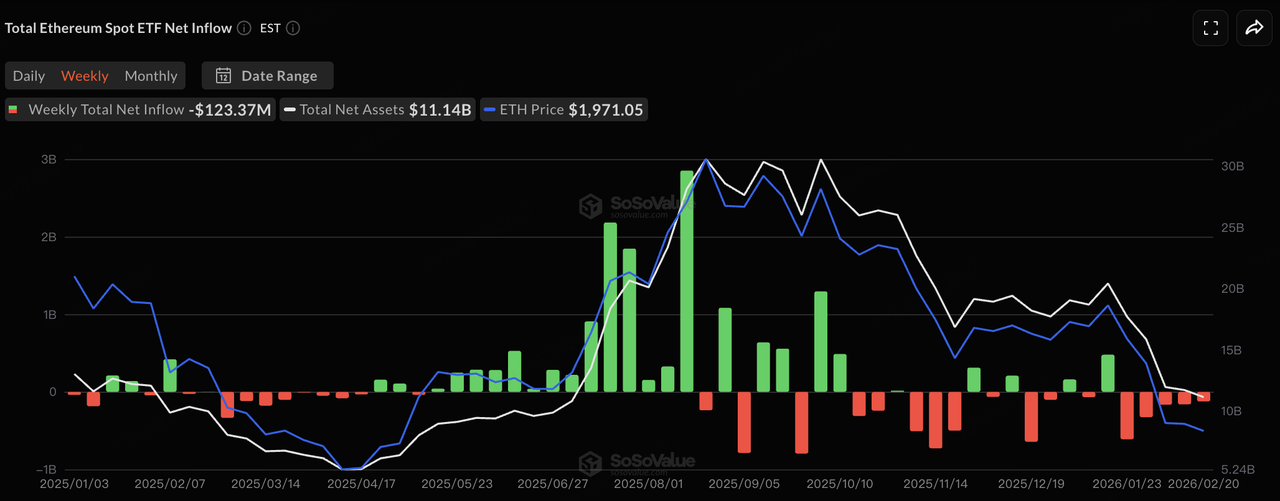
According to KuCoin’s analysis from April 2026, spot Bitcoin ETFs have acted as a “sponge” during this cycle—whenever miners are forced to sell Bitcoin, ETF inflows have largely continued to absorb this selling pressure, preventing prices from falling below the support level of approximately $60,000. This suggests that whether selling pressure from miners translates into actual price declines depends largely on institutional capital flows during the same period, rather than the miners’ behavior itself.
Clearance PriceThis refers to the price level at which it becomes economically unfeasible for miners to operate; it is not a single figure, but rather a dynamic relationship between revenue and total operating expenses. According to KuCoin’s analysis from April 2026, the more efficient S21 XP miners can remain operational until the price reaches approximately $55,000, while older hardware begins shutting down once Bitcoin falls below around $75,000.
For most mid-sized mining companies, the break-even point for electricity costs alone is around $74,000, but when hardware depreciation, facility maintenance, and general and administrative expenses are factored in, the “total cost” for many U.S.-listed mining firms has exceeded $100,000 per coin. This means that even if the price of BTC falls below the electricity cost line, miners’ actual responses will vary significantly depending on their respective capital structures—which is a concrete manifestation of the “two lines” logic mentioned at the beginning of this article.
Why is there such a big difference in the shutdown prices among different miners?
The gap stems primarily from three factors: electricity costs, the efficiency of mining rig models, and whether costs are shared with other business operations (such as AI computing power hosting). According to a CoinShares report, several large mining companies have cumulatively announced AI and high-performance computing contracts totaling over $70 billion. Companies such as WULF, CORZ, CIFR, and HUT have effectively transformed into “data center operators that mine as a side business,” which means that traditional mining cost models can no longer fully reflect these companies’ true financial resilience.
Many investors equate “BTC falling below mining costs” directly with “the market has bottomed out,” but according to a CoinDesk report from February 2026, the Bitcoin price was approximately $70,000, about 20% lower than the estimated average production cost of $87,000, Historically, during the bear markets of 2019 and 2022, Bitcoin continued to consolidate at low levels for some time after falling below production costs before gradually rebounding to near the cost line. This suggests that falling below the cost line is not, in itself, a precise market-timing tool, but rather provides a reference range.
What does this mean in practical terms for the average investor?
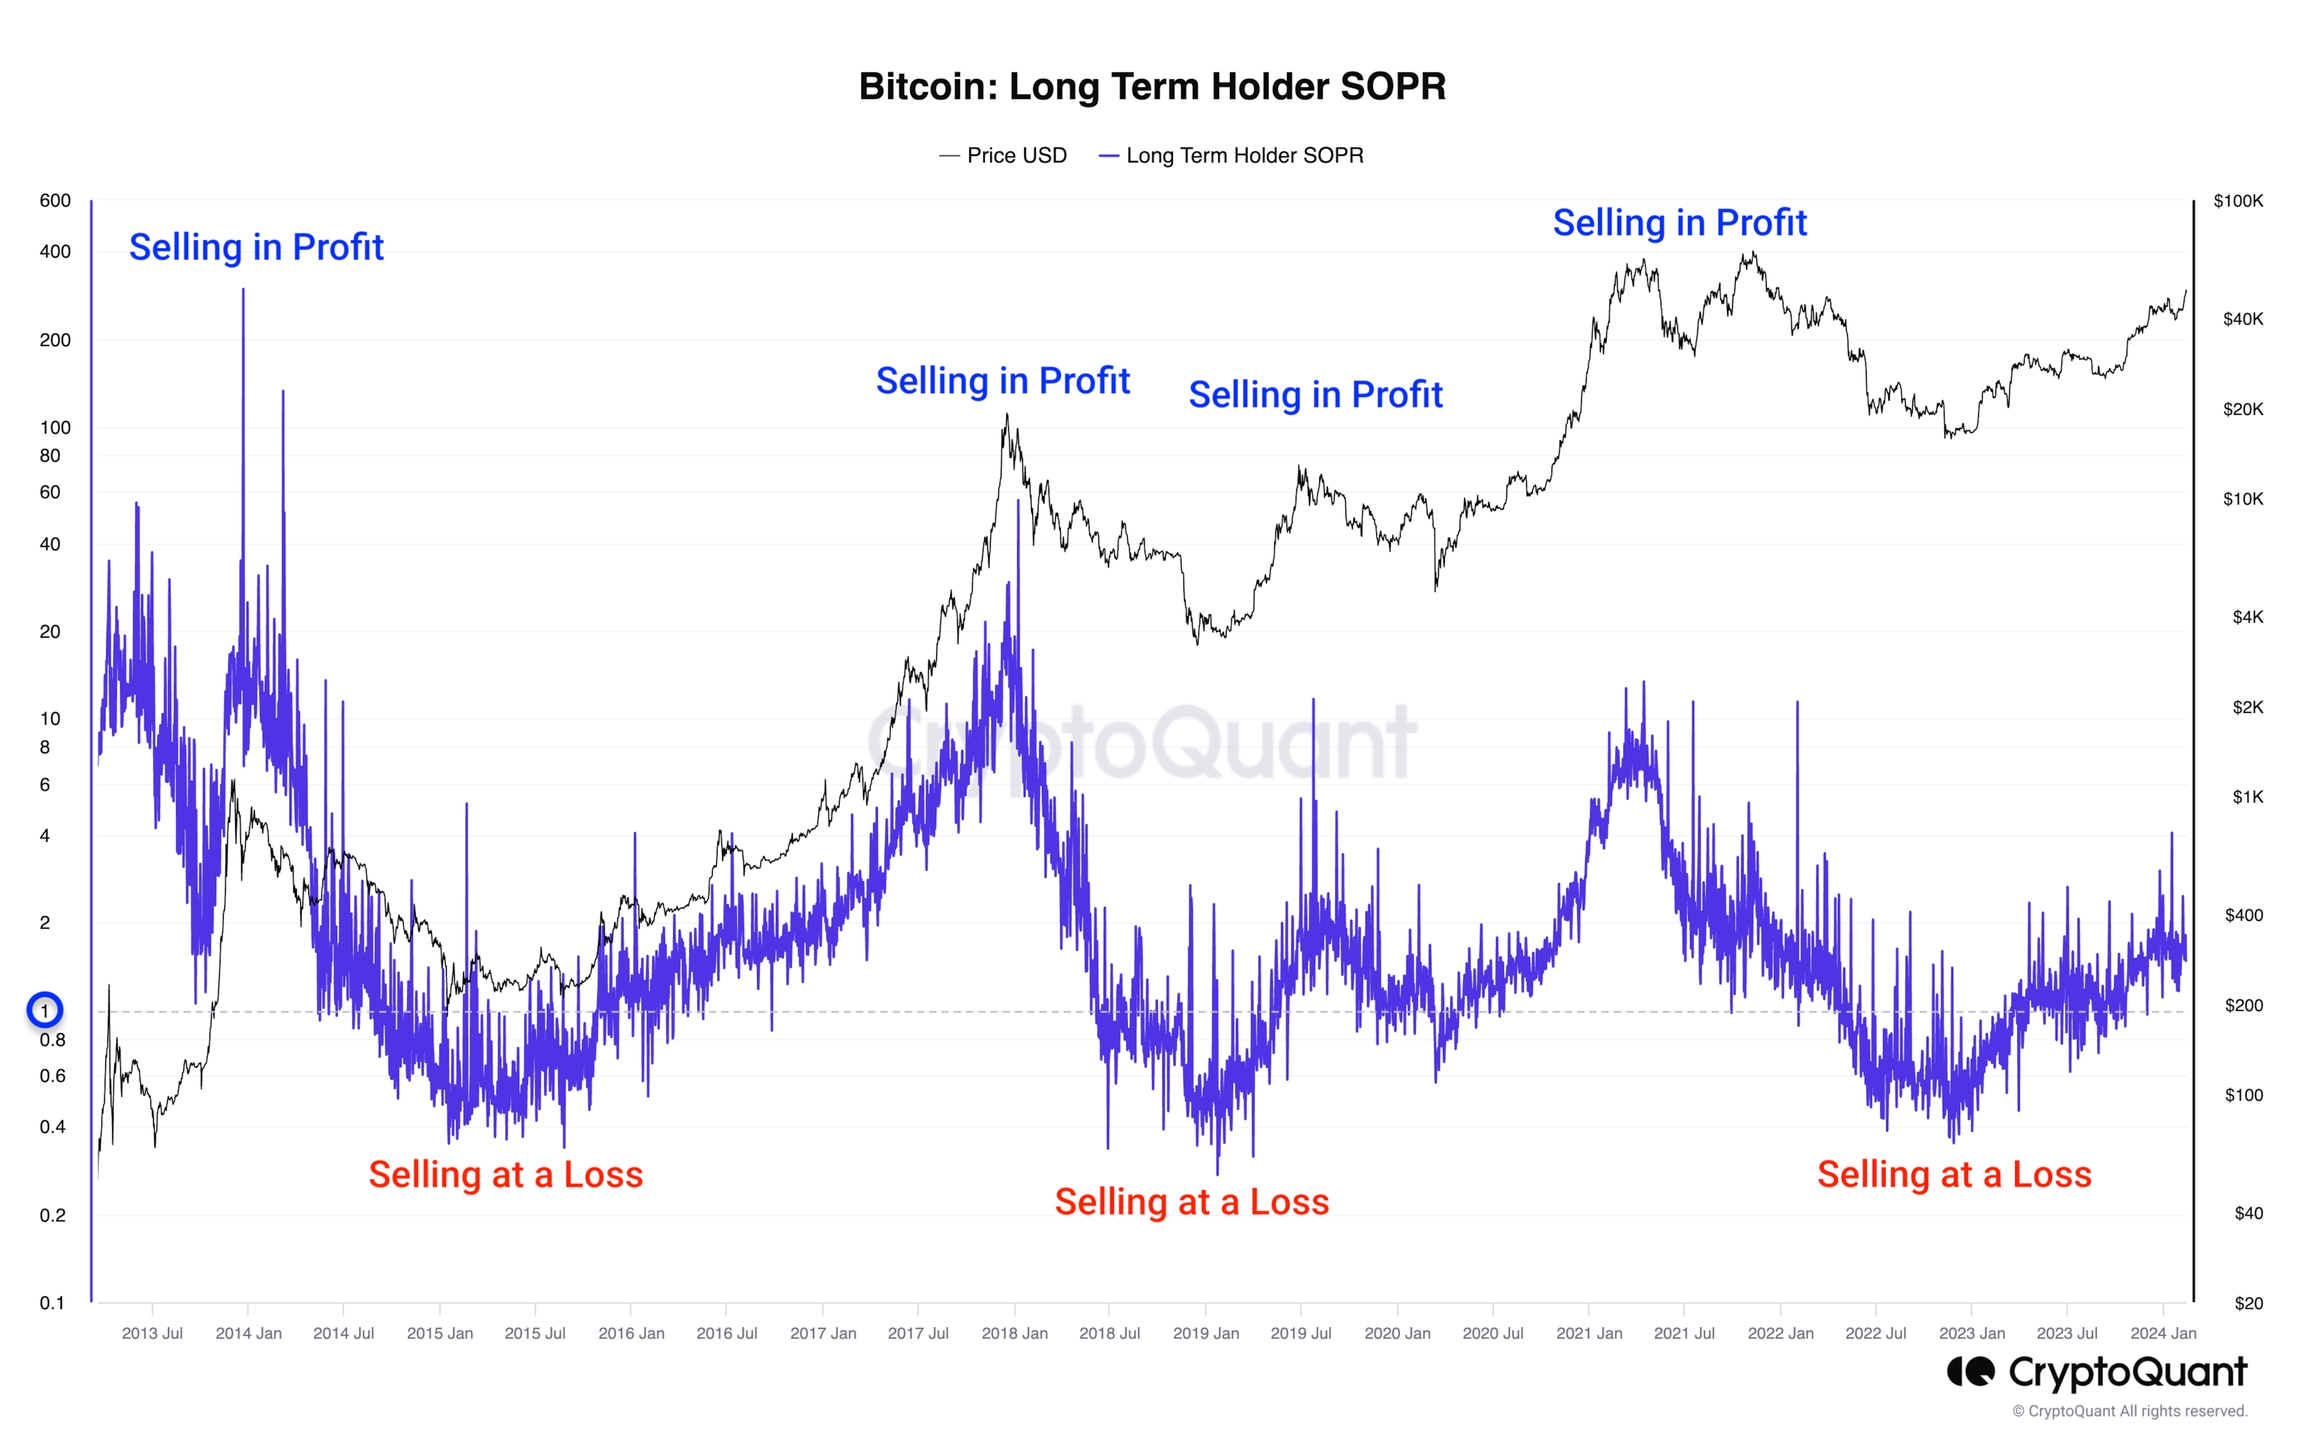
The miner cost model is better suited for determining whether “the market has entered a historically rare period of deep undervaluation” rather than for precisely pinpointing market bottoms. Cross-validating it with other on-chain metrics (such as LTH-SOPR and changes in exchange reserves) is more reliable than relying solely on the cost line.
Frequently Asked Questions
Q1: If miners’ costs fall below the spot price, does that mean they’re about to sell their coins? A1: Not necessarily. As long as cash flow remains positive, miners can continue to operate even if they are reporting accounting losses; it is a negative cash flow—not the full-cost break-even point itself—that truly forces them to sell.
Q2: How large can the difference be between cash cost and full cost? A2: Taking data from the third quarter of 2025 as an example, MARA’s cash cost was approximately $39,235; however, when depreciation and equity-based compensation are factored in, the total cost can exceed $100,000—a difference of more than double.
Q3: Does the capitulation of miners necessarily mean the market has bottomed out? A3: Historically, miners’ capitulation has often coincided with market bottoms, but this pattern only holds if new demand steps in to absorb the supply at the same time. If ETF funds are flowing out at the same time, this pattern may not apply.
Q4: Can retail investors use the mining cost model to determine when to buy or sell? A4: It can be used as a reference range, but we do not recommend using it on its own. We suggest cross-validating it with indicators such as LTH-MVRV and exchange reserves to avoid misjudgments caused by relying on a single indicator.
Q5: Why is there such a big difference in the shutdown prices among different miners? A5: This is primarily influenced by electricity costs, mining rig efficiency, and the availability of additional revenue sources such as AI computing power; mining companies with strong capital structures can continue to operate even if they are operating at a full-cost loss.
Conclusion
The next time you see a headline like “BTC Falls Below Mining Costs—Miners Are Headed for Collapse,” ask yourself this first: Is the article referring to cash costs or total costs? Distinguishing between these two is the first step in assessing the selling pressure from miners.
Extended Reading:
2026 OSL User Referral Code Tutorial
Getting to know OSL: What is it? Security, Features
2026 Hong Kong OTC Trading Compliance Methods
MEXC Global Exchange In-Depth Review
Hyperliquid perpetual contract DEX analysis
Hot and Cold Wallet Principles: Self-Custody vs Exchange Custody
Disclaimer
The content of this article is for informational and educational purposes only and does not constitute any investment advice, nor does it represent the position and views of Monsterblockhk. All information and analyses are based on publicly available information as of a specific date and are subject to change. Readers are advised to exercise independent judgment and carefully assess the associated risks. This article does not constitute any invitation or solicitation to buy or sell securities, funds or other financial products, and Monsterblockhk is not a licensed investment adviser of the Securities and Futures Commission of Hong Kong. If necessary, readers should consult a licensed professional for advice on their own circumstances.