


The PCE (Personal Consumption Expenditures Price Index) has been the official inflation target used by the U.S. Federal Reserve (Fed) to set monetary policy since 2000. It differs fundamentally from the CPI (Consumer Price Index)—which you often see in the news—in terms of its scope, data sources, and weighting adjustment mechanisms. The two do not measure the same thing: the CPI measures the cost of the goods and services you personally purchase, while the PCE measures the total cost to society of maintaining your standard of living. Understanding this difference is the first step in assessing the probability of a Fed rate hike, and it is also key to avoiding making investment decisions based on the wrong indicator.
This article provides a comprehensive breakdown of the three fundamental differences between PCE and CPI, the three tiers of inflation indicators used in the Fed’s policy-making (Headline PCE, Core PCE, and Trimmed Mean PCE), and how these figures influence cryptocurrency market trends through the liquidity transmission mechanism.
Why aren't the inflation figures you see in the news the basis for the Fed's decisions?
Every time the U.S. releases inflation data, the headlines in financial media almost without exception feature the same number: CPI. The figure for May 2026 was 4.2%, and as soon as the news headlines broke, market sentiment shifted immediately. However, this figure—which causes investors so much anxiety—is not the metric that Fed Chair Kevin Warsh actually relies on when setting interest rates.
In 2000, the Fed officially shifted its primary inflation reference indicator from the CPI to the PCE, citing that the PCE’s calculation method more consistently reflects long-term trends. It was not until 2012 that the Fed formally set its long-term inflation target at 2% in its “Statement on Long-Term Goals and Monetary Policy Strategy,” with the official definition of this target being the annual growth rate of the overall PCE.
This highlights a significant discrepancy in perception: while the market and the media focus on the CPI, the Fed bases its decisions on the PCE. When these two figures diverge, using the CPI to predict the Fed’s actions will lead to erroneous conclusions.
A Sygnum analyst clearly stated: “This is a Fed that reacts to each data point; the truly important figure isn’t just the CPI, but the Core PCE, because that’s the Fed’s preferred indicator.”
Three Fundamental Differences Between the PCE and the CPI
First: Whose expenses are included?
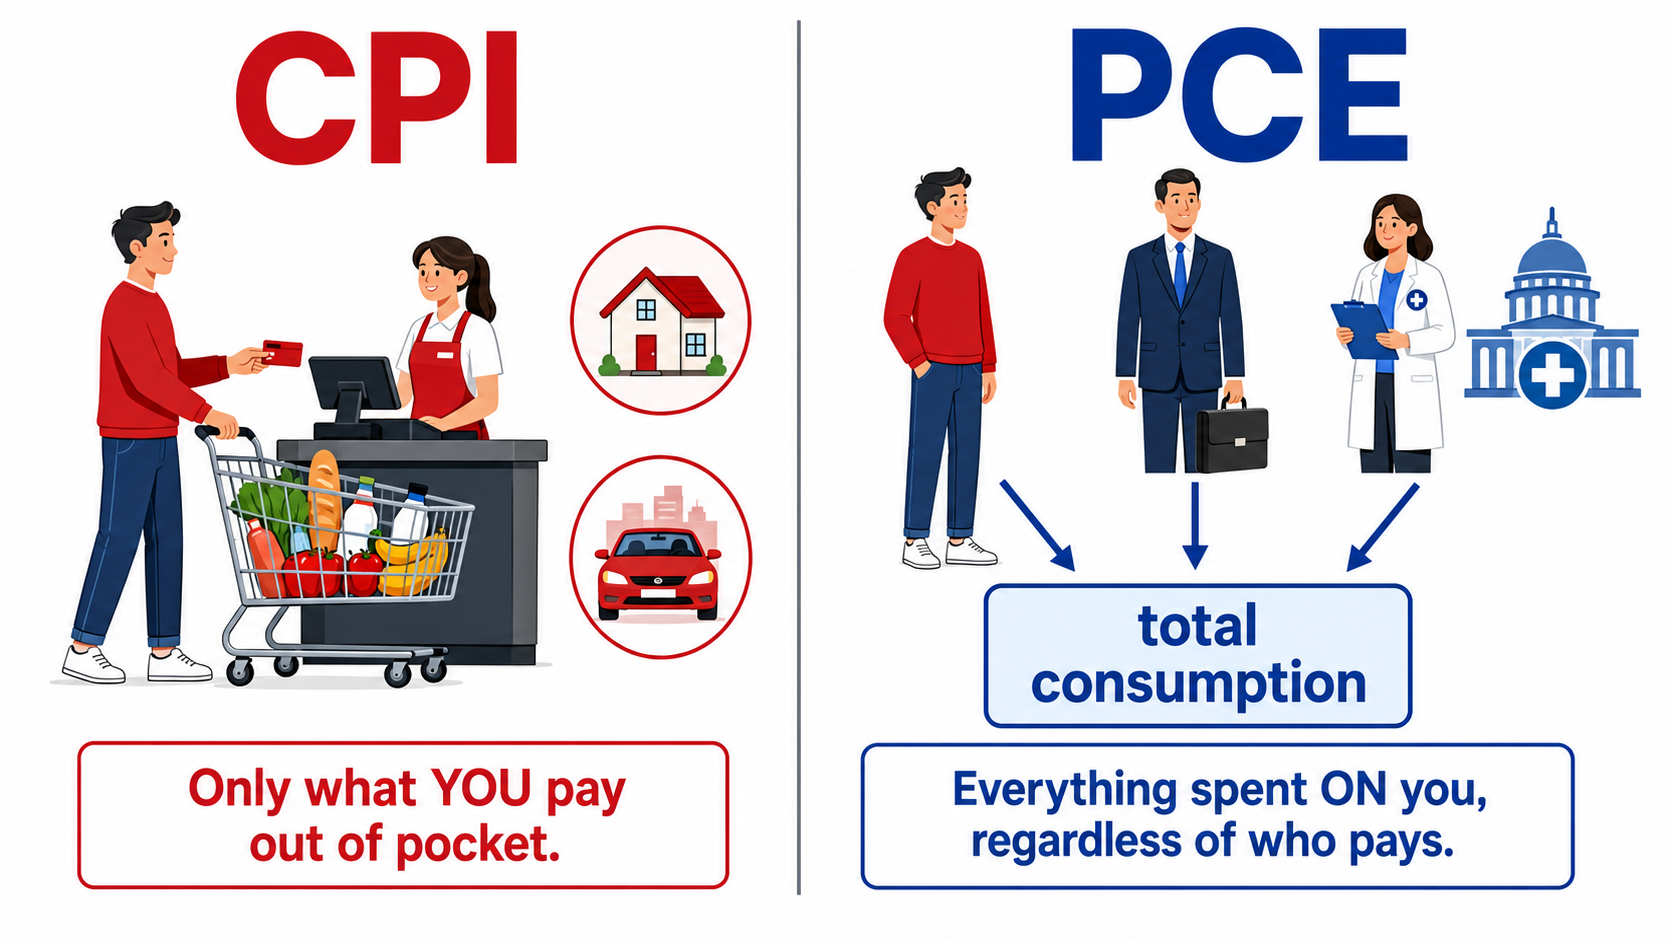
This is the most fundamental difference between the two metrics—and it’s something most people have never given much thought to.
The CPI is designed to track the daily purchases of a typical urban household—food, housing, transportation, healthcare, and entertainment. Its data comes from household expenditure surveys, which ask, “How much did you personally spend?” Therefore, the CPI only counts the amounts you personally paid out of pocket.
The PCE measures something entirely different: how much more expensive, overall, are all the goods and services you, as a consumer, purchase—regardless of who pays for them? Its data comes from corporate sales reports, not household surveys.
Take medical expenses as an example. Suppose your total monthly medical costs are 1,500 HKD: you pay 200 HKD out of pocket, your employer’s insurance covers 800 HKD, and the government’s Medicare subsidy covers 500 HKD. The CPI only accounts for that HK$200, while the PCE accounts for the full HK$1,500.
Because the PCE covers a broader range of items than the CPI, the Fed has placed greater emphasis on the PCE as an inflation indicator since 2000, and it has also served as the primary reference for monetary policy decisions. According to statistics from the U.S. Bureau of Economic Analysis, total PCE accounts for approximately 70% of national GDP, while the CPI covers only about 75% of the PCE.
This difference results in the weighting of healthcare services in the PCE (approximately 16–18%) being significantly higher than that in the CPI (approximately 7%). Since healthcare costs have been rising at a rate of 5–8% over the long term, a systemic disparity exists between the two indices.
Second: The substitution effect—if you switch to buying cheaper goods, has the index kept pace?
The CPI uses a relatively fixed basket of goods, assuming that you buy the same items every month. What if beef prices go up by 30%? The CPI assumes you continue to buy beef in the same proportion, thereby overestimating the inflation you actually experience.
The PCE updates its consumption weights every month to reflect your actual shift toward purchasing cheaper alternatives. If beef gets more expensive and you switch to buying chicken, the PCE calculates your spending based on your new consumption mix.
The PCE better reflects how consumers adjust their spending behavior in response to price changes. In June 2022, the year-over-year rate of increase in the U.S. CPI peaked at 9.1%, while the PCE rose by only 7.0%—a difference of nearly 2 percentage points.
Structurally, this substitution effect causes the PCE to be approximately 0.4–0.5 percentage points lower than the CPI over the long term; this gap is not accidental, but rather an inevitable result of the two indices measuring different issues.
Third: How Housing Costs Are Calculated
Housing is the largest single category in the CPI, accounting for over 33%. It is calculated using “Owner’s Equivalent Rent” (OER)—that is, an estimate of how much rent you would charge if you were to rent out your own home. This figure is not based on actual transactions; it is subject to estimation errors and lags behind the actual market by approximately 12–18 months.
The weight of housing expenditures in the CPI is roughly twice that in the PCE. The PCE is designed to avoid these issues; it not only has a broader scope and more frequent weight updates, but also explicitly incorporates factors related to alternative consumption behaviors.
The housing component accounts for only about 15% of the PCE, and its calculation method more closely reflects actual spending. This means that during periods of rapid rent increases, the CPI severely overestimates inflation; when rents decline, the CPI lags behind in reflecting the actual situation.
Why is Core PCE more important than Headline PCE?
Now that we understand PCE, we need to make a further distinction Headline PCE(Overall) and Core PCE(Core).
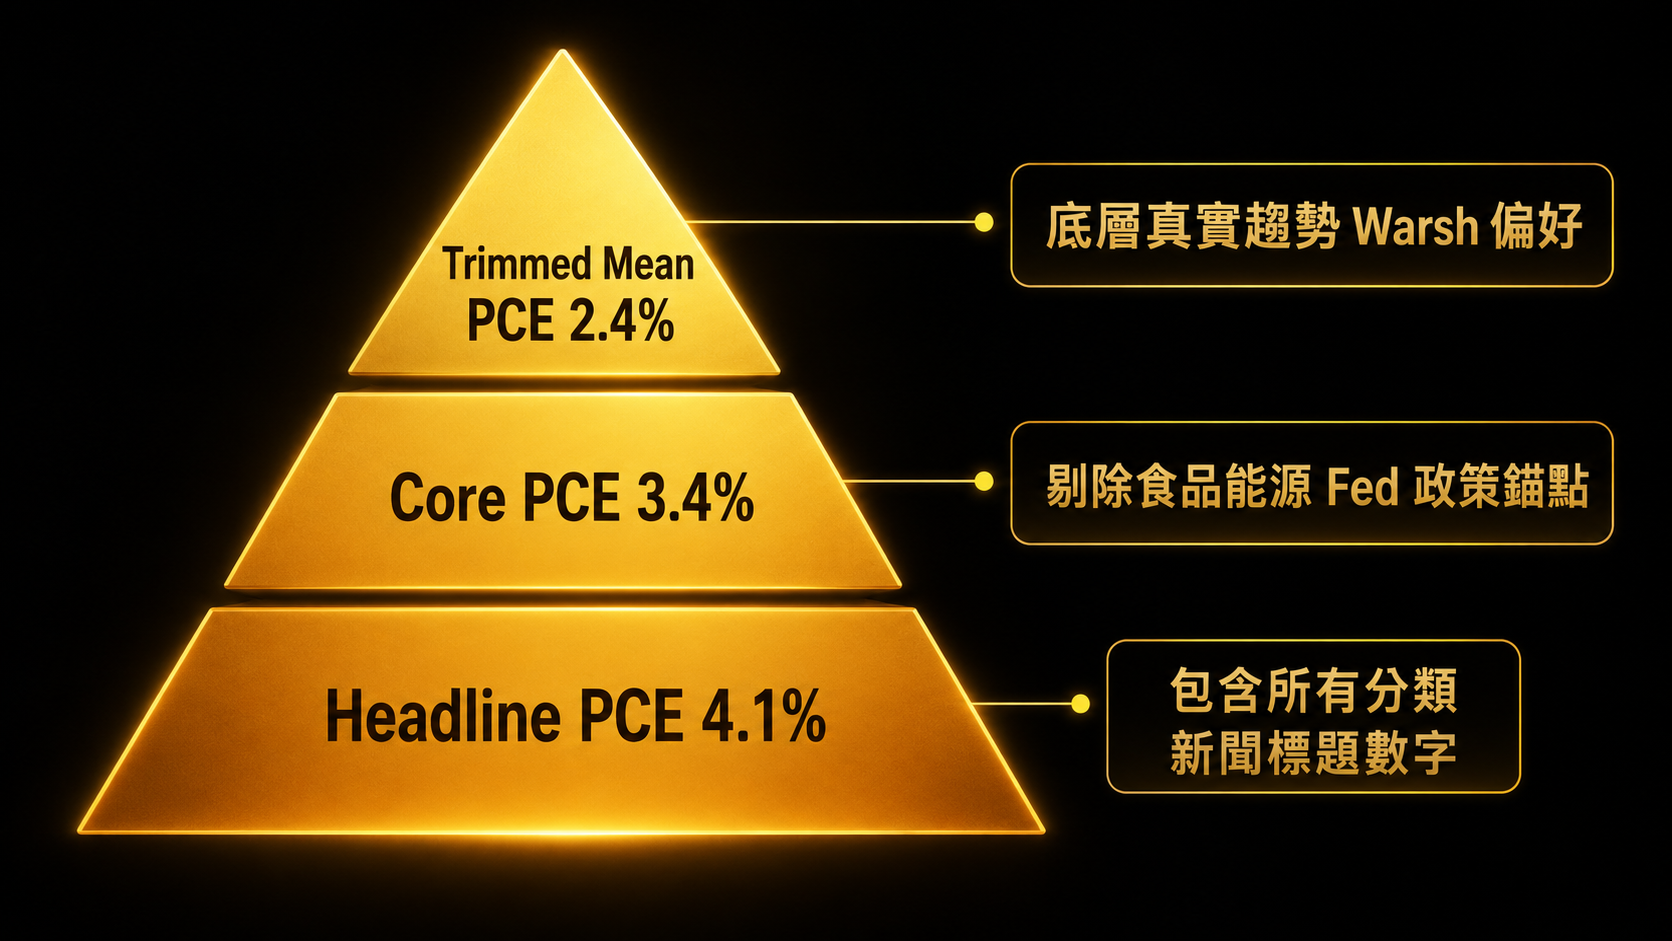
Headline PCE covers all goods and services, including food and energy. Core PCE excludes food and energy—the two categories most susceptible to temporary factors—in order to identify a more stable underlying inflation trend. May 2026: Headline PCE 4.1%, Core PCE 3.4%.
Core PCE is one of the most important indicators the Fed uses to assess interest rate adjustments, as it is a price index that measures personal consumption expenditures—in other words, an indicator of the underlying trend in inflation.
One important example illustrates the significance of the difference between the two. In March 2026, Headline CPI surged to 3.3% due to energy shocks, but the Core CPI reading came in below expectations, prompting Bitcoin to rebound from around $70,500 to over $72,400. The market saw through the noise in the surface figures and shifted its focus to the core data the Fed was truly monitoring, viewing the oil-price-driven spike as a temporary phenomenon.
This case clearly illustrates that when there is a discrepancy between the headline and the core, the market follows the core rather than the headline.
Trimmed Mean PCE: The indicator Warsh mentioned himself
Of all the inflation indicators, the one that is least understood but deserves the most attention since Warsh took office is Trimmed Mean PCE(Trimmed Mean PCE), published monthly by the Federal Reserve Bank of Dallas.
The Trimmed Mean is calculated as follows: Take the monthly price changes for all individual PCE categories, sort them from lowest to highest, remove the two most extreme values at either end, and then calculate the weighted average of the remaining values— —The Dallas Fed’s version excludes the 31% category with the largest increase and the 24% category with the largest decrease. The goal is to filter out one-off shocks and capture the true underlying inflation trend.
At his Senate confirmation hearing in April 2026, Warsh made it clear: “I am most interested in the underlying inflation rate, rather than one-off price fluctuations caused by geopolitical events or changes in beef prices. My preferred metric is what is known as the trimmed mean. We strip out all tail risks and all one-off factors, and then ask ourselves whether broad price movements have had second-order effects on the economy.”
Following the release of the June 2026 PCE data, InvestorPlace noted that the figure Warsh was really focusing on was the Trimmed Mean PCE, which stood at 2.42%—nearly one percentage point lower than the Core PCE of 3.4% for the same period. During his confirmation hearing, Warsh even referred to Core PCE as a “rough swag” of inflation—in other words, a “scientific guess.”
Extended Reading:
2026 OSL User Referral Code Tutorial
Getting to know OSL: What is it? Security, Features
2026 Hong Kong OTC Trading Compliance Methods
MEXC Global Exchange In-Depth Review
Hyperliquid perpetual contract DEX analysis
Hot and Cold Wallet Principles: Self-Custody vs Exchange Custody
Why Might the Trimmed Mean PCE Currently Underestimate Actual Inflation?
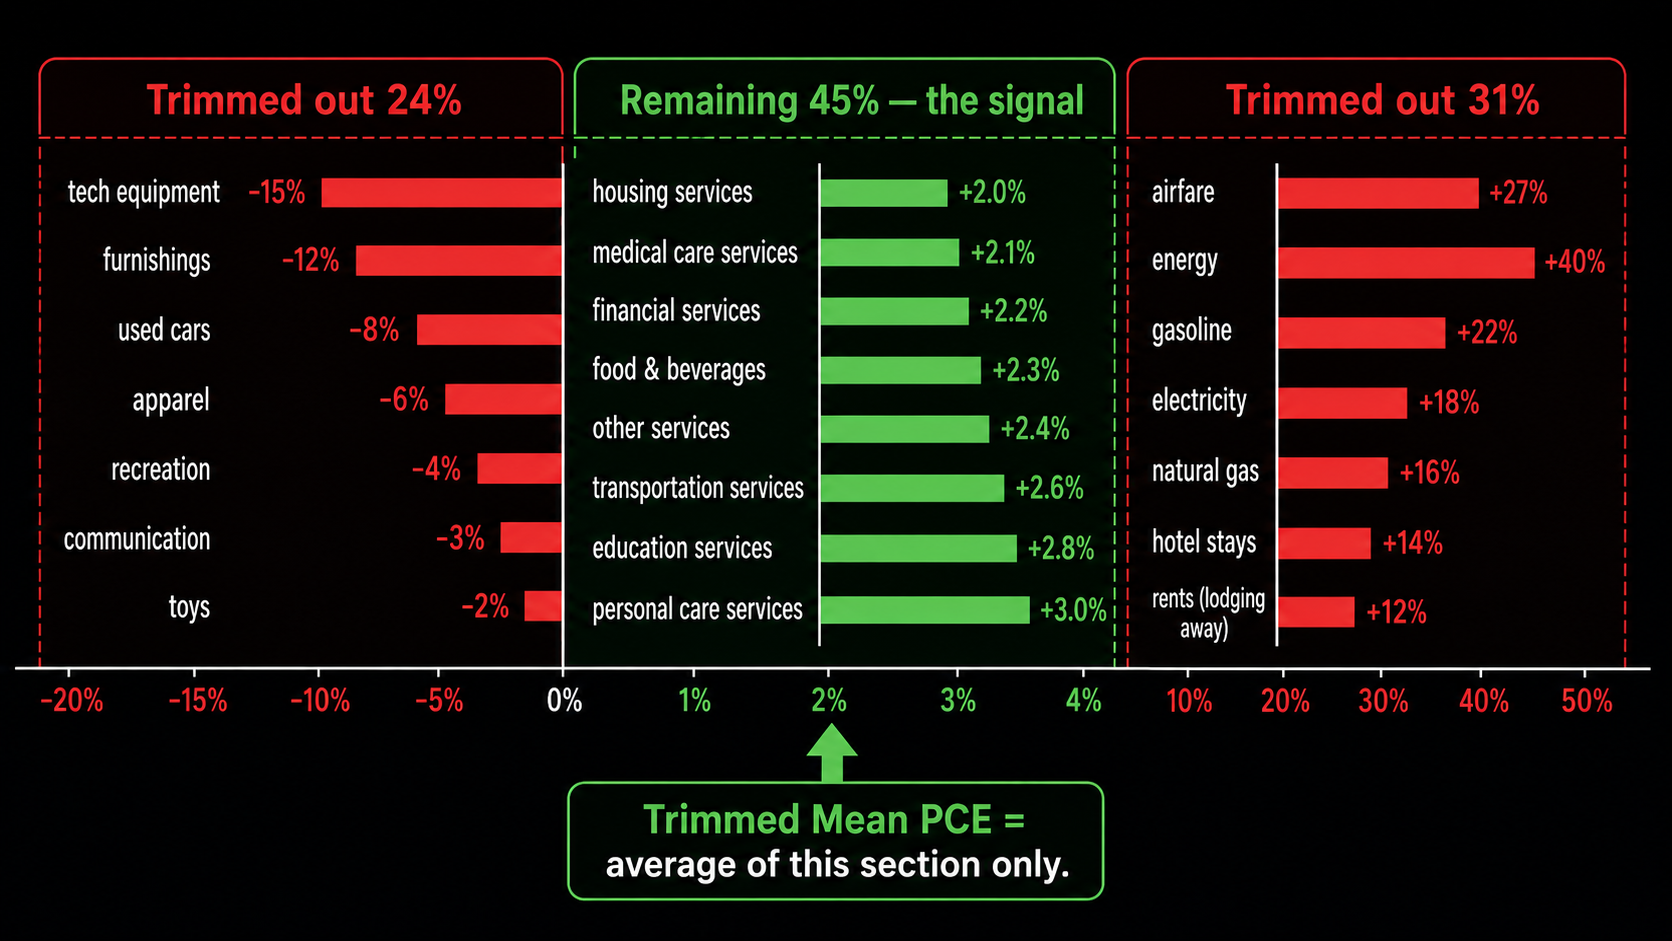
The design assumption behind the Trimmed Mean is that events that fall into the right tail (sharp increases) are random, one-off shocks—such as weather, accidents, or seasonal factors. It is reasonable to exclude them.
However, a technical issue has arisen in the current environment. In a speech, a researcher at the Dallas Fed explicitly acknowledged that the current skew in the data distribution caused by the oil price shock has led the Trimmed Mean to exclude too many price categories with large increases, resulting in a reading that is lower than the actual underlying inflation trend.
Bhave, an analyst at Bank of America, also pointed out a potential contradiction: even if oil price and food shocks are trimmed out, they may indirectly push up the Trimmed Mean by preventing other shocks from being trimmed out; meanwhile, Warsh argues that we should look beyond these one-time supply-side shocks, creating a logical contradiction between the two positions.
Charles Schwab’s analysis also notes that the Trimmed Mean historically lagged behind the Core PCE by more than one percentage point during the sharp rise in inflation in 2021–2022, suggesting that in a broad-based inflationary environment, the Trimmed Mean may cause policymakers to fall behind the curve.
Three Market Interpretations of These Indicators
Viewpoint 1: The headline is alarming, but the core is what really matters
Looking at the process by which CPI data is mechanically passed on to the price of BTC, the issue for cryptocurrency traders is not the level of the headline figure, but rather how much of the energy cost is reflected in the core categories the Fed is actually monitoring.
This view holds that as long as Core PCE does not accelerate significantly, the high headline readings can be disregarded, and the market will eventually return to rational pricing.
Viewpoint 2: The low value of the trimmed mean is misleading
Critics argue that Warsh’s decision to switch to a lower target after five consecutive years of inflation exceeding the target amounts to “moving the goalposts.” A researcher at the Brookings Institution warned that switching to a new metric after the Fed had failed to meet its inflation target for five consecutive years could be viewed by the market and analysts as a “change in the rules of the game,” threatening the central bank’s credibility.
"Fed Chairman Kevin Warsh has declared himself a supporter of the Trimmed Mean indicator, but the reality is that inflation is clearly on the rise."
— Richard de Chazal, Macro Analyst at William Blair,CNN Business Report, June 2026
Viewpoint 3: The second-round effects are the real risk
Analyst Daan Crypto Trades noted on X that the Bitcoin bull market is facing a major test, warning that a close below a key support level would confirm a technical breakdown. He pointed out that as Strategy and MicroStrategy continue to hit new lows, a breakdown in Bitcoin’s higher time frames would only add to the pressure.
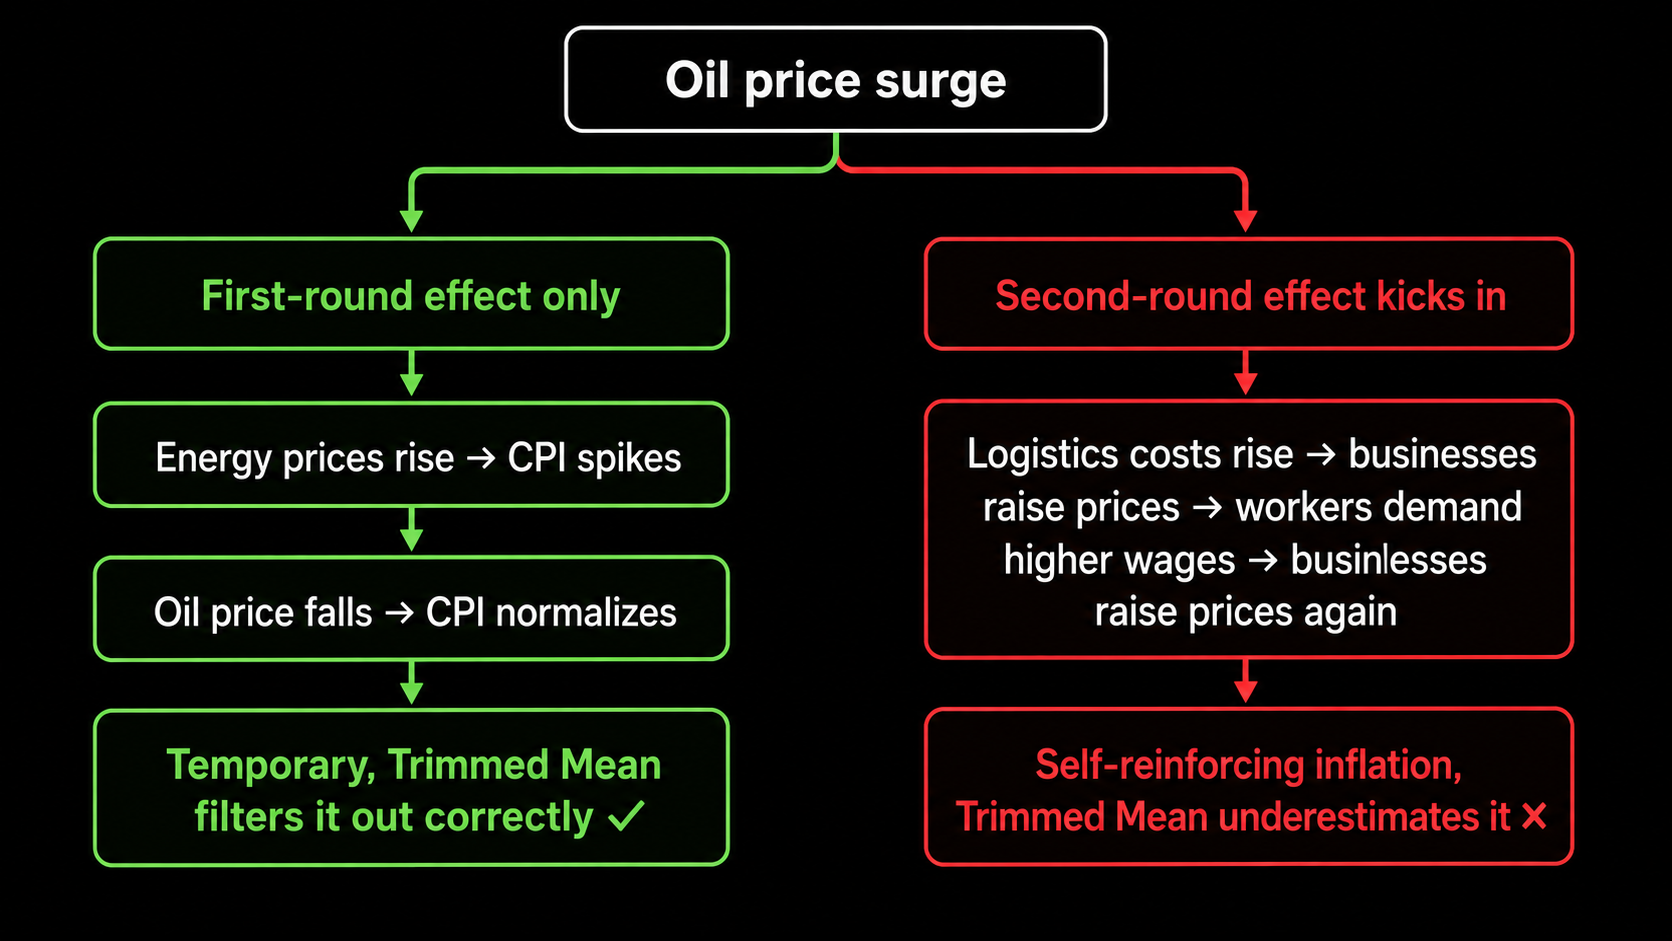
The underlying logic of this view is that oil price shocks occur in two stages. The first-round effect is direct—oil prices rise, gasoline becomes more expensive—and this is temporary. The second-round effect is systemic—rising logistics costs trickle down to restaurants, hotels, and airlines; workers demand pay raises to compensate; companies pass on these costs again; and inflation becomes self-reinforcing. If the second-round effects continue to spread, the Trimmed Mean 2.4% will no longer reflect reality but will instead be an undervaluation that masks the true underlying inflation.
How Do Inflation Figures Affect Cryptocurrencies Through the Liquidity Transmission Channel?
BTC's Real-Time Response Mechanism
Bitcoin does not react directly to inflation data, but rather to the way that inflation data affects the probability of the Fed’s interest rate decisions; this transmission mechanism operates through the CME FedWatch tool. The CPI is released at 8:30 a.m. Eastern Time. Algorithmic trading systems reprice federal funds futures within seconds, directly altering the interest rate probabilities in FedWatch, and the crypto market moves almost in sync.
In March 2026, the Fed kept interest rates at 3.50–3.75% and hinted at only one possible rate cut that year; Bitcoin immediately fell by about 5% to $71,100, with outflows from spot Bitcoin ETFs reaching $708 million that day.
The Liquidity Transmission Chain in the Era of Institutions
The liquidity transmission chain is: Core PCE → monetary policy expectations → risk appetite → cryptocurrencies. A report by Bank of America clearly states that cryptocurrencies are “at the end of the liquidity transmission chain and benefit only when risk appetite expands.”
On June 25, 2026, after the Headline PCE reached 4.1%, Bitcoin fell below $59,000, triggering forced liquidations for more than 130,000 traders, with the total liquidation amount approaching $900 million. The market sentiment index fell to 15, indicating extreme panic.
This figure highlights an important reality: even if your analysis of indicators is completely accurate, short-term fluctuations in market sentiment alone can still result in massive financial losses. Understanding indicators is just the first step; position sizing and risk management are your true moats. If you need more in-depth on-chain data to support your decision-making,Nansen Providing real-time tracking of institutional capital flows is one of the key tools for gauging shifts in market sentiment.
How to Interpret PCE Data Correctly: A Practical Framework
Whenever PCE data is released, it is recommended to interpret it in the following order, rather than just looking at the headline figures:
Step 1: Look at the Headline PCE
This is the figure in the news headline. Just because it’s high doesn’t mean the Fed will act immediately, as it may be driven primarily by energy shocks. Ask yourself: How much of this reading is attributable to energy?
Step 2: Examine the deviation of Core PCE from expectations
While the absolute value of Core PCE is certainly important, the deviation from market expectations is even more significant. A 3.4% figure that meets expectations and one that exceeds expectations have entirely different impacts on the market.
Step 3: Examine the Trimmed Mean PCE
During Warsh’s tenure, the significance of this figure has increased substantially. However, we must also assess whether the current low readings truly reflect underlying stability, or whether they are the result of oil price shocks causing an excessive accumulation of right-tail values, which mechanically depresses the readings.
Step 4: Assess whether a second-round effect is occurring
Is inflation in the service sector (restaurants, hotels, airlines) persisting? Are wages rising at an accelerated pace? If so, the low reading of the trimmed mean is unreliable. If not, Warsh’s optimistic view is supported by stronger data.
Frequently Asked Questions
Q1: Which of PCE and CPI more accurately reflects my actual cost of living?
These two metrics reflect answers to different questions. The CPI more closely reflects the inflation you “feel” yourself, because it only accounts for the expenses you pay out of your own pocket. The PCE is closer to the “actual cost to society as a whole of maintaining your current standard of living,” including costs you may not feel but that do exist. For Fed policy, the PCE is a more accurate benchmark; for how your personal wallet feels, the CPI is more intuitive.
Q2: Why do news outlets report on the CPI more often than the PCE?
The main reason is that the CPI is released about two weeks earlier than the PCE. By the time the CPI is released, the market has already priced in the news; by the time the PCE is released, there is limited new information. However, for investors, the PCE is the true basis for the Fed’s decision-making. Understanding the difference between the two allows you to anticipate the Fed’s next move sooner than those who only look at the headline CPI figures.
Q3: Does a low Trimmed Mean PCE reading mean that inflation isn't a serious problem?
We cannot simply draw this conclusion. Researchers at the Dallas Fed have warned that the skewed data distribution caused by the current oil price shock may lead the Trimmed Mean to underestimate actual underlying inflation. Furthermore, the Trimmed Mean has historically tended to be higher than Core PCE; the fact that it is currently unusually lower than Core PCE is in itself a cause for concern. This data should be interpreted in conjunction with inflation in the service sector and wage data.
Q4: When are the PCE figures released? What period do they cover?
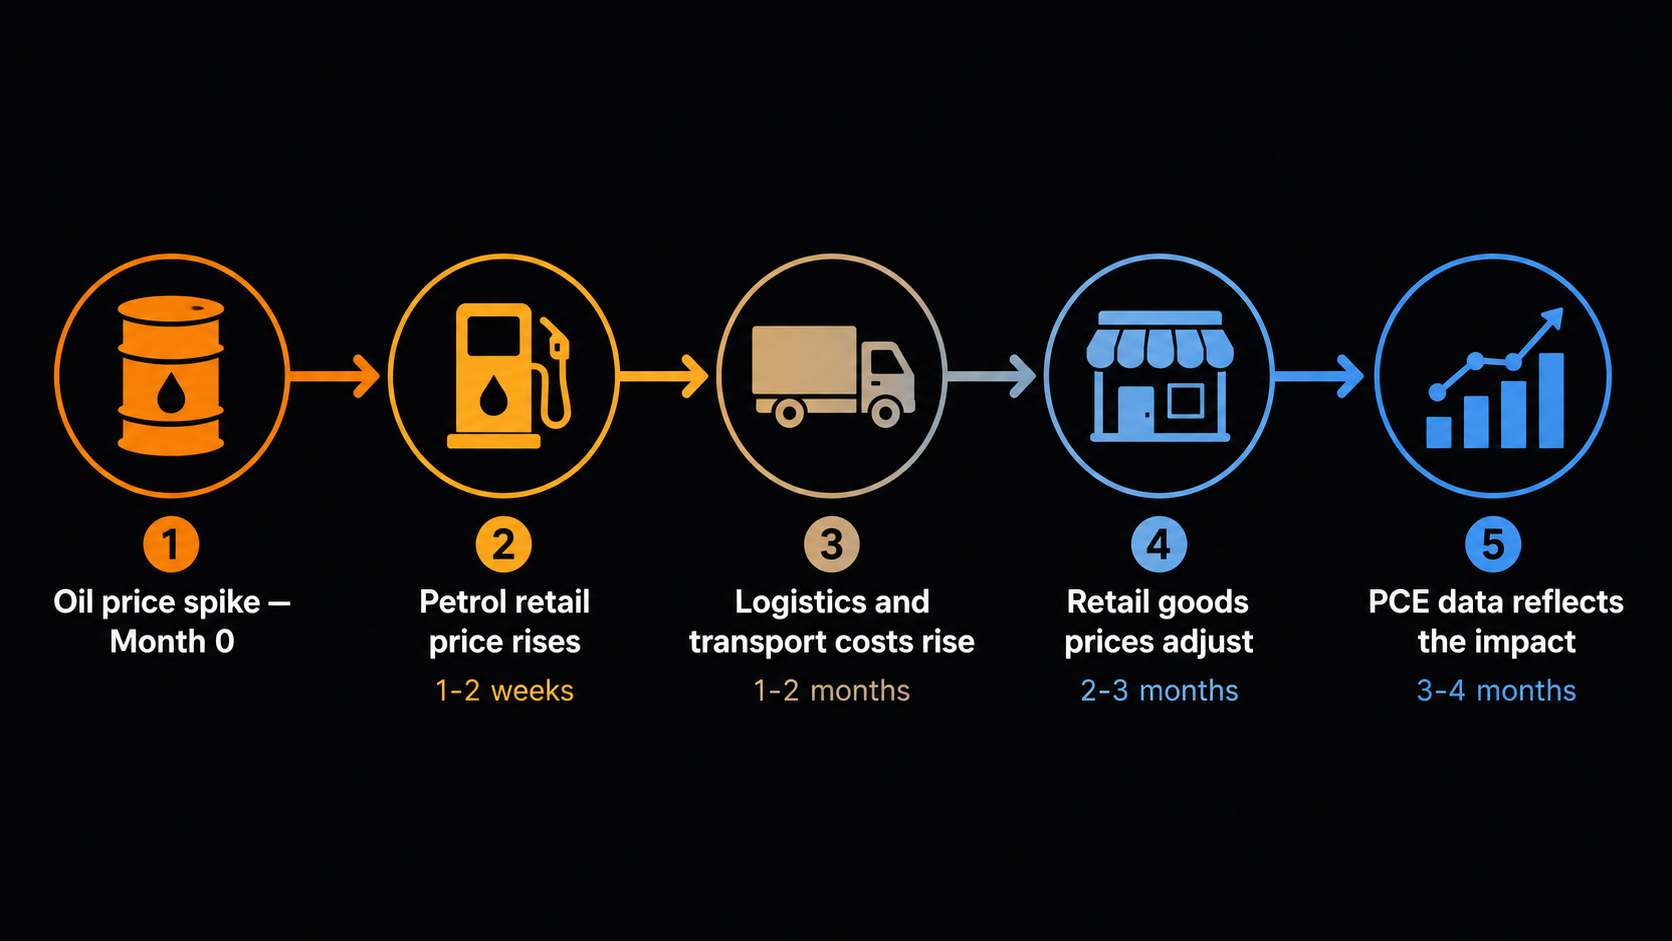
PCE data is released on the last Friday of each month, reflecting the previous month’s figures. Because it involves extensive compilation of firm-level data, the release is approximately two weeks later than that of the CPI. It is important to note that the impact of oil prices is not fully reflected in the PCE data until it has passed through multiple stages; the transmission from crude oil to retail consumer goods takes approximately 2–4 months, so PCE readings lag somewhat behind actual conditions.
Q5: Do interest rate hikes always have a negative impact on cryptocurrencies?
Not necessarily. To be more precise:An interest rate hike that exceeded market expectationsOnly then will there be a significant negative impact, as that would represent new negative news. If the market has already priced in an interest rate hike and the actual outcome meets expectations, the impact may be limited, or there could even be a “sell-the-news” rally. The key lies in how many rate hikes the market has already priced in, and whether the actual outcome exceeds those expectations.
Conclusion
Understanding inflation data isn’t about memorizing a few numbers; it’s about understanding what each number measures. The CPI reflects market sentiment; the PCE indicates the actual pressures on the overall economy; the Core PCE serves as the Fed’s policy anchor; and the Trimmed Mean PCE is the tool Warsh uses to filter out noise and identify underlying trends.
These three tiers of indicators were all present in May 2026: 4.1%, 3.4%, and 2.4%. Which figure is closer to the truth? The answer depends on the duration of the Middle East conflict, whether oil prices can remain low, and whether inflation in the service sector has become self-reinforcing. This assessment is more valuable than any prediction regarding the timing of interest rate hikes.
If you want to systematically learn how to use macroeconomic indicators to assess trends in the cryptocurrency market, you can join Monsterblockhk Community Or check out the guide compiled for beginnersCrypto Crash Course Package, building a comprehensive investment decision-making framework from the ground up.
Extended Reading:
2026 OSL User Referral Code Tutorial
Getting to know OSL: What is it? Security, Features
2026 Hong Kong OTC Trading Compliance Methods
MEXC Global Exchange In-Depth Review
Hyperliquid perpetual contract DEX analysis
Hot and Cold Wallet Principles: Self-Custody vs Exchange Custody
Disclaimer
The content of this article is for informational and educational purposes only and does not constitute any investment advice, nor does it represent the position and views of Monsterblockhk. All information and analyses are based on publicly available information as of a specific date and are subject to change. Readers are advised to exercise independent judgment and carefully assess the associated risks. This article does not constitute any invitation or solicitation to buy or sell securities, funds or other financial products, and Monsterblockhk is not a licensed investment adviser of the Securities and Futures Commission of Hong Kong. If necessary, readers should consult a licensed professional for advice on their own circumstances.