
The world of cryptocurrencies is full of opportunities, but it also harbors risks. Especially for beginners, learning the right trading metrics is the key to building a solid strategy.
This article will introduce 23 super useful cryptocurrency indicators in an easy-to-understand way, which not only come from the official data of the professional platform CoinKarma, but also help you understand the market dynamics step by step, starting from technical analysis.Whether you're a newbie or a trading beginner, this article will give you a sensible and practical guide as we explore how these cryptocurrency indicators can become your trading partners!
Before we begin, let's clear up a concept:
Cryptocurrency indicators are like the pulse of the market, they are based on data analysis and help us determine buying and selling opportunities, risks and trends. But remember, there is no such thing as a perfect indicator, you need to use a combination of them and pay attention to the market conditions!
To make the content more systematic, I have divided these indicators into six categories, each starting from a basic definition and progressively explaining the logic, uses, and practical applications for novices.
This categorization makes it easier for you to grasp the overall framework and avoid confusion.
1. Liquidity Indicators: Capturing Market Depth and Intentionality
Liquidity indicators are indispensable tools in cryptocurrency trading, they focus on the balance of buying and selling in the spot order book and help us predict turning points in a volatile market. These indicators are particularly suited to the 90% market hours, a consolidation phase without strong external capital interruptions. Let's look at them one by one.
LIQ
Its core definition is a value calculated by standardizing the ratio of buy orders (bid) to sell orders (ask) in the spot order book, which is specifically used to assess the cost of pulling or crashing orders by the majors. The logic behind it is that when the depth of the bid order is thick, the demand for funds for the main force to smash the order will increase, and vice versa, which allows us to explore the potential reversal point of the market, especially in the contractual high-leverage environment, which is often used by the main force to harvest retail investors.
When LIQ is high (>3), it means that the order book is deeper below and the cost of capital for the main force to smash the order is higher, which is more likely to form a bottom in the oscillator.
When LIQ is on the low side (<-3), it means that order book selling is deeper above and the main pulling force has higher capital cost, which is more likely to form a top in the oscillator.
In short, LIQ is a way to see the cost of pulling and smashing orders by the main force. When the cost of controlling the price is too high, the market is more likely to take a turn How to use the LIQ Indicator Currency Circle 90%'s market is an oscillator, with a low percentage of unilateral upward and downward movement. When the market is in the wide range of the oscillator, that's when the LIQ indicator is at its most effective.
Overall LIQ
This is a market capitalization-weighted overall liquidity indicator that covers a number of mainstream currencies such as BTC, ETH, etc. It is similar in definition to LIQ, but with a broader scope that is not limited to a single market. Its logic is to capture changes in broad market liquidity and provide more sensitive short-term signals, as retail investor behavior tends to magnify imbalances in the overall order book.
Usage:LIQ + Overall LIQ: Overall LIQ is more sensitive than LIQ and provides more short-term trading opportunities.
The pitfall to avoid is ignoring the timeframe and over-trading on the hourly charts, resulting in noise interference.
Accumulated LIQ
Add time accumulation to the LIQ base, defined as the sum of LIQs for a specific period in the past (e.g. 24 hours), with adjustable parameters such as (24, 60, -60). Logically, this enhances trend persistence and avoids false signals at a single point in time, especially useful on 4-hour charts.
Usage: Treat it as a strict filter and place multiple orders when the accumulation value exceeds 100.
A common misconception is that parameters are not tuned, resulting in missed opportunities, which is recommended to be optimized through backtesting.
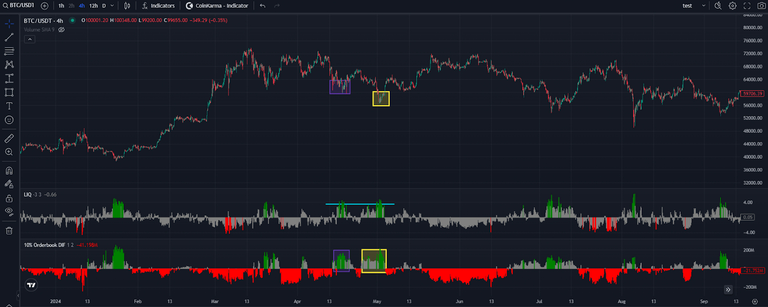
10% Orderbook DIF
Order Book 10% The bid-ask spread within the depth of 10% shows the Notional USD value. The logic is to evaluate absolute liquidity rather than relative values, allowing us to distinguish the true depth difference for the same LIQ.
Usage:Using the 10% Orderbook LIQ-Notional USD, it can be seen that for the same LIQ data, buyer liquidity in the yellow box > buyer liquidity in the purple box.
10% Overall Liquidity
Similar to the 10% Orderbook DIF, but focusing on the overall market 10% Orderbook Difference can be displayed in USD or BTC units. Logically, this is an absolute indicator of the liquidity of the market, with a default threshold of 300M USD or 3000 BTC.
Usage: Use it as a confirmation tool to reinforce long confidence when the buy side exceeds the threshold.

CVD (Cumulative Volume Delta)
The CVD is an indicator used to analyze the balance of power in a market, which accumulates the difference in volume between buy and sell orders over a certain period of time. In short, CVD can be regarded as a representation of the buying and selling power of market orders over a period of time.
For LIQ, it is based on the bid and ask of the spot order book, which is composed of "limit orders". When the strength of the "market orders" continues to push in a certain direction during a period of time, it is possible that most of the "limit orders" are consumed at the same time, which will result in an overstretching of the LIQ related data. To avoid overstretching, we can use CVD to filter this situation.
Usage: Filter LIQ red bars with CVD up to avoid shorting too early.
Here is an example: Excessive extension of Overall LIQ red bars. The yellow box shows frequent Overall LIQ red bars, but the price is hitting highs repeatedly, and we observe the CVD, we can see that the buying in this period is very intense, which causes many sell orders (ask) "limit orders" to be consumed, resulting in an excessive extension of the Overall LIQ. Therefore, we can observe the CVD to filter out the short option.

USDC/USDT Premium
An indicator that measures the spread between USDC and USDT. Although both are pegged to USD1, in actual trading, the price will be at a discount or premium due to the difference in market demand and capital pressure, and the price difference between the two can be used to determine the direction of short-term capital flow and market pressure, which has a high correlation with the short-term price fluctuations of BTC.
In the absence of external incremental capital, the market is mainly dominated by existing capital circulating within the market, and USDT is the main settlement unit of the cryptocurrency market as a whole, and its transaction volume and depth account for a much larger share than that of USDC in the long term, so BTC/USDT versus BTC/USDC is the former's benchmark price that really determines the direction of the price in the short term.
Therefore, when the main force has an incentive to sell BTC in the short term, it will start with BTC/USDT, which has higher liquidity, and this will result in the phenomenon of BTC/USDT < BTC/USDC, as the former is actively under pressure (the opposite is true for buying), and then the arbitrage space will appear. Arbitrage capital will buy lower priced BTC in BTC/USDT, sell higher priced BTC in BTC/USDC, and then sell the acquired USDC back into USDT to complete the arbitrage, so when the USDC/USDT Premium goes below 0, it usually means that the main capital driving the market is selling BTC.
Usage: When Premium < 0, arbitrage behavior suggests selling pressure. Beginners can use < 0 as a signal to reduce short-term top positions.
Misunderstandings fail when external capital is flowing in and market conditions need to be recognized.
2. Smart Money Indicator: Following the Giant Whales and Organizations
Smart Money Indicators track the behavior of majors and institutions, helping us to capture the information advantage, especially at the turning point. These indicators are suitable for use during bearish and bullish periods, so that novice traders can learn to "follow the market" instead of blindly following.
Bitfinex is an exchange with a long history. Bitfinex is part of iFinex, which is also the parent company of Tether, the largest stablecoin issuer by market capitalization. After years of observation by the CoinKarma team, they found that the giant whales on Bitfinex have a huge impact on the market, and therefore developed several indicators to track the behavior of these whales to determine how the market is perceived by smart money. CoinKarma has developed a number of indicators to track the behavior of the giant whales to determine how the smart money in the market perceives the current market conditions.
Bitfinex BTCUSD LONGS
Defined as the total leveraged position of BTC spot on Bitfinex. The logic lies in the fact that the giant whale often builds its position against the trend, sucking in chips when it goes down and getting out when it goes up.
Usage: Observe the position increase to a certain level and follow through to the bottom.
The misunderstanding is that the initial motion is regarded as the bottom, and the actual acceleration needs to be equal to the slope.
Bitfinex Margin Long Size
Bitfinex Exchange Leveraged USD+USDT Position Size, the higher the indicator, the larger the position size of the giant whale's leveraged borrowing. Since Bitfinex's spot leverage is mostly in BTC, the trend of this indicator is highly similar to the BTCUSD LONGS, although the sensitivity is higher than that of the BTCUSD LONGS.
Usage: Use it to confirm the LONGS signal.
The pothole is in ignoring the position cycle, which is of limited help in the short term.
Bitfinex Premium
Bitfinex-BTCUSD vs Coinbase-BTCUSD premium/discount relationship, when the market sentiment is low and the giant whale enters the market to build up its position on the left side, it will cause Bitfinex BTCUSD to have a premium price compared to Coinbase; on the contrary, when the market sentiment is high and the giant whale is slowly exiting, it will cause Bitfinex BTCUSD to have a premium price compared to Coinbase. Coinbase discount, when the indicator exceeds the threshold, it is often the bottom or top of the range.
Bitfinex ETH/BTC Whale Indicator
Bitfinex ETHBTC Net Longs leverage position. When this indicator is higher, it means that Giant Whale Leverage has a higher position to buy ETH with BTC.。
The following is the comparison of ETHBTC exchange rate after Bitfinex closed its large ETHBTC Longs position. It can be found that after Bitfinex closed its position, the ETHBTC exchange rate has a higher chance of hitting the peak, and it is a safer choice to transfer from ETH to BTC at this time.
Usage: Consider switching from ETH to BTC after an indicative high.

CME Smart Money
There are some giant whales in the market whose positions can influence the market to a certain extent because when they are willing to buy, they bring buy-side support to the market. In addition to this, information gaps have always been one of the fundamentals of making money in the market, and watching whales that have the opportunity to have information gaps will give us a chance to discern what the market is likely to do in the future.
CME Smart Money is an integrated indicator that screens different types of traders at the CME to select the group whose position changes have an alpha on the trend.
Whenever CME smart money turns net short, it is usually a phase high; 2024 / 10 CME smart money increased its position from 1,800 to 12,000, which is the largest position and increase in data, and then BTC welcomed the unilateral market to break the 100K mark.

USD/USDT Interest Rate
In addition to the perpetual contracts and funding rates that are unique to the cryptocurrency space, the cryptocurrency space still has borrowing rates that are common in traditional finance. The lending rate is the interest rate generated by spot lending on a centralized exchange. Therefore, there are two key points to analyze: the first is the centralized exchange, and the second is the level of interest rates. The current centralized exchanges are based on Binance, currently the largest exchange in the world, and Bitfinex, the oldest exchange known for lending.
This is a more cyclical indicator. Due to the nature and composition of the two exchanges, we consider Binance's borrowing behavior as retail and Bitfinex's borrowing behavior as primary.
- When Bitfinex's borrowing rate > Binance's borrowing rate, it tends to be the bottom of the market
- When Bitfinex's borrowing rate < Binance's borrowing rate, it is often the top of the market
3. Inflow of Funds Indicators
The Capital Inflow Indicator evaluates external capital movements and helps to determine the strength of a trend. Ideal for trend identification, allowing novices to avoid depleted markets.
BTC ETF Net Flow
The reason why CoinKarma recorded the BTC ETF Net Flow is because it was discovered through the recovery that some of the inflows into the BTC ETF were arbitrage positions, which did not have a significant impact on the market. This is different from our intuitive belief that net inflows into the BTC ETF are bullish for the aftermarket, while net outflows are bearish for the aftermarket, so that we can judge the sentiment of the futures market based on the state of the inflows into the BTC ETF. We can judge the sentiment of the futures market based on the inflows into the BTC ETF.
- When market sentiment is good (overheated), futures premiums become high -> Arbitrage capital buys BTC ETFs and shorts CME futures
- When market sentiment is poor (panic), futures premium becomes low -> Arbitrage capital sells BTC ETF and closes CME short position
So every time the BTC market tops, CME's position rises sharply (corresponding to a rise in the hedge fund's net short position), and when the market goes down, CME's position goes down as well.
These arbitrage funds don't need to wait for the delivery of goods at maturity to close their positions, they just need to keep shorting the market during FOMO and closing their positions when the market panics as the market sentiment continues to dissipate and converge in the cryptocurrency market, and then they can make money.
Through observation, IBIT is favored by arbitrage capital due to its investor attributes and fee advantage, while other ETFs have similar arbitrage behavior, but on a much smaller scale than IBIT, so we compare the BTC price with IBIT's inflow and outflow, and we can see that when IBIT's net outflow or inflow stops (closing out arbitrage shorts, selling ETF positions), it is almost always the case that IBIT is at the bottom of a short-term bottom. short-term bottom.

Stablecoin Supply
Defined as the market capitalization of USDT, USDC liquidity. The logic reflects the inflow and outflow of funds, and an increase in USDT implies an increase in liquidity.
- It can be observed that in 2022 as the market falls, the market value of USDT falls as well → capital flows out of the market and one can expect the market liquidity to continue to diminish
- As the market starts to recover in 2023-2024, the market value of USDT will rise as well → With the inflow of capital into the market, you can expect the market liquidity to continue to increase

Through replay, we found that USDC may form a bottom if it diverges from the price and increases against the trend in the short term. For example, if Overall LIQ shows a green bar and USDC increases its issuance by more than 1 billion dollars, a short-term regional bottom will be formed.

Cumberland USDT Distribution

Cumberland is the largest transit point for USDT and a major partner of Tether's Treasury, which often accepts USDT increases and distributes them to exchanges or institutional clients. A simple increase in USDT does not necessarily mean that funds are flowing into the cryptocurrency, as some of the new funds may be used for cross-border settlements, the gray industry, or other over-the-counter transactions.
CoinKarma monitors the actual flow of incremental funds on an hourly basis by tracking the addresses of Cumberland's interactions with the Tether vault to determine if these funds are actually entering the exchange and creating actual buy orders into the market. In the most recent cycle, early 2024, late 2024, and the rapid uptick in mid-2025, it was possible to observe Cumberland injecting large amounts of USDT into the exchange, adding significant liquidity to the market.
How to use Cumberland USDT Distribution?
Red box below: Cumberland USDT Distribution has accumulated over $500 million in transfers in 7 days.
Assuming that the transfer of large amounts of USDT to the exchange after minting is seen as a force for taker buy in the next 1-2 weeks, the effectiveness of the red bar of the LIQ correlation indicator after the red box (7-day cumulative transfer of more than $500 million) will likely weaken, and following this logic, you can avoid opening a short position too soon after encountering the red bar.

The following will be restored with Overall LIQ:
1. As shown above, switch to the daily line and highlight the K-line in the red box where the Cumberland USDT Distribution has transferred more than $500 million in 7 days.
2. Switching back to the hourly box and comparing the Overall LIQ red bar after the red box (7-day cumulative transfers of over $500 million), you can see that a large amount of USDT was transferred to the exchange at ➀➁, and then the market continued to move upward in defiance of the Overall LIQ red bar (at the red arrow).

LIQ Red Column: A relatively high-accuracy short signal in an oscillator.
Question: In the case of a strong unilateral uptrend, the red bar can easily lead to an "early open short → get gapped".
solution (a math problem): Combined with Cumberland USDT Distribution, it is possible to recognize "supported by large USDT inflows" in advance and avoid misjudgments.
4. Sentiment and Options Indicators: Finding Market Heat and Expectations for Volatility
Sentiment indicators capture greed and fear, and the options section is more advanced. Ideal for overheating/panic periods, allowing newbies to learn to think backwards!
Future Basis Rolling APY
Usually, when the futures market becomes more optimistic, most people in the market will go long, which will cause the premium of the forward delivery contract over the spot to widen, and the Rolling APY will rise accordingly. Therefore, the Future Basis Rolling APY, like the Funding Rate, can be used to measure the market's sentiment.
Historically, BTC's Rolling APY for the most recent quarterly contract has the following significance:
- Below 0 = Armageddon (occurred during the 2020/3/12 crash)
- 0-5% = Extreme panic.
- 5%-10% = Market Cooling
- 10%-15% = Market Microheat
- 15%-20% = Market Frenzy
- 20% and above = FOMO
The default value is (5, 20), and the user can adjust the parameter by using the overlay disk.
Like the funding rate, in the past, when the BTC spot ETF was not yet approved, it was relatively difficult for formal funds to obtain BTC exposure, but now it is very convenient to buy ETFs and short contracts, which will suppress the spread between the contract and the spot and make the data somewhat blunt. Therefore, when using Rolling APY to judge market sentiment, it may be necessary to lower the standard. In the past, 20% or above was considered FOMO, but at this stage, Rolling APY up to 15%-20% may already be considered FOMO.
OI-Weighted Funding Rate
The calculation is weighted according to the BTC perpetual contract positions of the major exchanges. When the contract market is optimistic, there is a strong sentiment for leveraged long positions, which causes the premium of perpetual contracts over spot to widen, and the funding rate to rise, so the OI-Weighted Funding Rate, like the Future Basis Rolling APY, can be used to measure the market's sentiment.
A situation of soaring capital rates (meaning that the price of the perpetual contract is much higher than the spot price) is likely to be the case:
1. Prices are on an uptrend and long positions are opened with passion and leverage, driving up the price of perpetual contracts.
2. prices are on a downward trend, long positions are aggressive and carry orders against the trend, resulting in relatively high prices of perpetual contracts
Either way, the situation is actually more unfavorable to the bulls:
1. represents optimistic market sentiment, and compared to the short side, the long side is more leveraged, it is more likely that the retail camp is opening a long position, and it is easier to roll over.
2. represents a potentially sizable long position that is about to be liquidated or stopped out, with the short side in the driver's seat
A situation where the capital rate is falling (meaning that the price of the perpetual contract is much lower than the spot price) is likely to be the case:
1. Prices are on a downward trend, and short positions are opened with passion and leverage, driving down the price of the perpetual contract.
2. the price is in an upward trend, short sellers are aggressive in opening short positions and carrying orders against the trend, resulting in the price of the perpetual contract relatively low
Either way, the situation is actually more unfavorable to the shorts:
1. represents a pessimistic market sentiment, and the short side is more leveraged than the long side, it is more likely that the retail camp is opening a short position, and it is more likely to roll over.
2. represents the possibility that a sizable short position is about to be liquidated or stopped out, with the long side having the upper hand.
Like Future Basis Rolling APY, when the BTC Spot ETF was not yet approved, it was relatively difficult for formal funds to gain exposure to BTC. Now that it is very easy to buy ETFs and short contracts, a large number of traditional institutions are entering the market for arbitrage, which will blunt the data on the Funding Rate. Therefore, when using the OI-Weighted Funding Rate to gauge market sentiment, the benchmark needs to be shifted downward compared to previous cycles.
BTC 25Δ Skew
Imagine a group of people in the market betting on whether BTC will go up or down in the future with "options". Options are like insurance policies:
- Call: A bet that BTC will go up, and by buying this, you are betting on it to go up.
- Put: betting that BTC will fall, buying this is like buying downside insurance.
Every option has a price, and the price depends on the "implied volatility (IV)", which simply means "whether the market thinks there will be chaos in the future, and whether there will be big shocks in the price".
25Δ Skew It is the implied volatility of a call option that is "about the same distance away from the current price" compared to a put option:
- Choose a Dummy Option with Delta = 0.25 (some distance from the current price, but not too far).
- Formula: Skew = IV of Put - IV of Call
You can tell what the market is thinking by looking at the numbers:
- Skew > 0 (positive): bearish insurance (Put) is more expensive → everyone rushes to buy downside insurance → the market is very scared, panicky and short-biased.
- Skew < 0 (negative): call bets (Calls) are more expensive → people rush to buy upside tickets → market is very optimistic, crazy high, long.
Extreme values are most useful:
- Skew > +8: Extreme fear, people buy Put to avoid risk → Panic often goes too far, this is often a short-term bottom (rebound opportunity).
- Skew < -8: extremely optimistic, people are crazy to buy, Call to bet on bullishness → greed is overdone, often short term tops (easy to retrace).
In a nutshell: BTC 25Δ Skew is a sentiment indicator that tells you if the market is too afraid to go down or too eager to go up. The more extreme it is, the closer it is to a turnaround, but remember to always check it with other tools.
Volatility Term Structure
The Volatility Term Structure compares the expected future volatility of Bitcoin options with different expiration times. Simply put, it ranks short-term (1 month), medium-term (3 months), and long-term (6 months) implied volatility of the par option (ATM IV) to see whether the market thinks it will be "chaotic in the near term" or "chaotic in the long term".
Normally, the longer the period, the greater the uncertainty, so long-term volatility is higher than short-term (1M < 3M 3M > 6M), an "inversion" is formed, which means that a big shock is expected in the short term, usually in extreme sentiment, such as before a bull market top or a bear market bottom.
How does it work?
- See full inversion (1M > 3M > 6M): Markets are expected to be in turmoil in the near term, and are bracing themselves for sharp volatility. Being alert at this time is often a precursor to a turnaround - inverted in an uptrend is prone to falling, and inverted in a downtrend is prone to bouncing.
- Inversions on an upward trend: Consider this as a Top Alert and consider reducing your position or prepare to short it.
- Inversion in a downtrend: Consider this as a bottom warning and start looking for an entry point or adding to your position.
- End of inversion, return to normal structure (1M < 3M < 6M): Volatility is expected to decrease and prices usually consolidate, making it a good time to take a break or lock in profits.
- Structure completely flat (1M ≈ 3M ≈ 6M): The market has no direction and is waiting for a big event. Fluctuations may occur at any time, so we suggest to wait and see.
Exchange App iOS Ranking
Usually when the market is slow, many people fade out of the market, resulting in less attention being paid to the market. However, when the market enters a frenzy of emotions, the news that many people are making money will cause people to rush into the market, and even the shoeshine boy will want to find a way to enter the market, which is commonly known as the "shoeshine boy effect".
Usage:The blue line in this indicator shows the popularity ranking of Coinbase's financial apps in the U.S. The lower the value, the higher the ranking and the closer to the top of the market.
Binance Insurance Fund
Binance Insurance Fund has been growing upwards for a long time, and it is only when there is a huge liquidation, which causes users to close out their positions, that the Insurance Fund may decrease. Therefore, when the Binance Insurance Fund decreases, we can judge that there has been an excessive liquidation in the short term, and it is especially useful to compare this data with the liquidation of a leveraged long position, which is usually the bottom of a phase. It is usually the bottom of the phase.
Recent Recent Posts:
2026 Latest 6 Free Coin Ring Tools Inventory|Where to find the data on the chain?
2025 Latest OKX Web3 Wallet Tutorial: Does it work? How to create it? A Guide to Safe Operation, Multi-Link Support, and Time-Limited Airdrops
2026 Latest Polymarket Tutorial|How to find out the insiders and realize the high win rate!
2025 New DeFi Beginner's Guide|Teaching you to earn stable money passive income! Introducing 3 popular programs, DeFiLlama tool tutorial!
5. Torrents and Filter Indicators
ALT Resilient Index (ARI)
An indicator designed to tell you if "the cottage currency is holding up" when "BTC is crashing".
Under normal circumstances, when BTC goes down, the cottage currencies usually go down even more (because people panic and sell their small coins for BTC or stablecoins). However, when the market is about to hit the bottom, the market maker (the main force) of the cottage currency will start to secretly buy back the chips that have been smashed out before, and then the cottage currency will not follow BTC to continue to fall heavily, or even fall less than BTC, or directly against the trend of a small rebound, which is a sign of resilience.
The ARI indicator quantifies this "resistance of the cryptocurrency against BTC" into a number. The higher the number, the harder the cryptocurrency market makers are protecting the market and the more they are willing to spend real money to take the sell-offs, which usually means that the short-term bottom is not far away.
How does it work?
- ARI > 3 (or higher): Walled Currency Showing Strong Resilience, Market Makers Protecting the Market → This is a good time to buy or add to BTC as it corrects sharply.
- ARI aloneAs long as you see the ARI surge above 3, especially when external bad news (e.g. war, interest rate hike, ETF sell the news) causes BTC to drop 10-20% unilaterally, you can directly regard it as a short-term low signal.
- Use with LIQ (recommended)When LIQ has green bar buying signal, but you are afraid of false bottom → wait for ARI > 3 at the same time and then enter, safety margin is greatly improved, avoiding the July 2024 Japan rate hike, first enter and then continue to be smashed lower.
- Bull Market Correction Specialty: In a bull market, there will inevitably be a few waves of 10-20% retracement, when you open the ARI chart to monitor, the occurrence of high values is the best opportunity to add positions.
- Exit Time: ARI falls from highs + BTC starts to rebound strongly → consider closing some of your positions at a profit.
LSUR Z Index
The LSUR Z Index takes the ratio of the number of "longs" divided by the number of "shorts" in a sustainable contract (LSUR), weights it by the number of positions in the lead currency, and then calculates how many standard deviations it is from the average of the past 14 days. To put it simply, it tells you whether there are an unusually large number of short sellers in the market now, and how much they deviate from the normal range.
In the past, the old rule that traders like to follow is LSUR long) → people are too pessimistic → it is easy to bounce back and buy in the short term. However, in the past few years, because of the large-scale entry of institutions, many people hold cash and short futures to hedge (not really bearish), so this old rule is often invalid, and even the opposite LSUR < 1 has become a short-term high signal.
CoinKarma's LSUR Z-Index quantifies this change into a Z-score (standard deviation), which lets you know how far it has deviated and helps you catch useful signals despite the new market structure.
The LSUR Z index should be read in conjunction with other CoinKarma indicators, as shown below:
1. Use Overall LIQ to determine possible market reversal points:
In an oscillator, the LSUR Z index resonates with the Overall LIQ to identify potential reversal points.
2. identify alerts that the LIQ correlation index and the LSUR Z index may be overstretched:
Yellow box: When both the LIQ correlation and the LSUR Z index show a possible pullback in the market, but the price is still strong, the effective factors in the oscillator are being passivated and a short position should be avoided. ( The market may be moving from an oscillator to a unilateral trend )
Purple box: When the LSUR Z index is less than -2, it can be filtered with the LIQ correlation indicator to avoid shorting the LSUR Z index alone.

Short Filter
No-Short Filter will be triggered when Market Pulse Index reaches a short value, but Cumberland USDT Distribution's USDT Accumulated Transfers for the last 7 days exceeds 10% overall liquidity (in USD).
How to use this indicator?
Short Filter is a filter to avoid going short in a unilateral uptrend.(as shown in the red X)The No-Short Filter may miss some shorting profit opportunities, but it can effectively avoid the situation of shorting too early and being shorted, as shown in Points A and B in the chart, and there are often better shorting opportunities after the No-Short Filter has been triggered (as shown in the orange arrows in the chart).

6. Composite Periodic Index
Karma Index
Defined as a composite indicator that quantifies multi-dimensional data, including liquidity, on-chain, etc. Logic identifies cycle bottoms and tops, with green arrows frequently being global bottoms.
- Frequent emergence of green color → means that it has entered the global bottom area, then you can use the buy strategy in batches, historically this kind of area buy can hold to the next round of big highs.
- Red color appears frequently → It means entering the global top zone, start selling in batches to lock in profits to avoid a big gap.

Do I get a discount for signing up for Coinkarma?
By learning these indicators, you have a solid foundation to move from novice to rational trader. But to really turn that knowledge into a real-world advantage, it's important to keep tracking real-time data and backtesting. That's the strength of the CoinKarma platform, which integrates these 23 indicators into a complete set of professional charts, alerts, and historical data, giving you a one-stop shop for monitoring the market's movements without having to piece it all together.
Although the free version of CoinKarma allows you to sign up and try out the basic features for free, the actual limitations are huge: you can only look at data older than 1 year (excluding the last month), no Ultron exclusive signals, no customized alerts, no watch lists and no advanced backtesting, so it's basically good for just "seeing" what the indicators look like, but it's hard to use it for real-world decision-making.
On the other hand, the paid version (especially the Gold plan) unlocks real-time data for 23 indicators, unlimited alerts, strategy backtesting, royalty screening and trading robot support, so you can really turn your knowledge into a trading advantage and avoid missing key opportunities.
Now through Recommended Links Sign up for CoinKarma and enter the promo code at checkout. Scott10If you choose the Gold plan, you pay only 10 USDT for the first month! This is a significant reduction in the cost of entry and allows you to experience one month of Premium Membership features, including unlimited indicator tracking and advanced strategy tools, with minimal risk.
Newbies are most afraid of spending a lot of money but can not learn, this wave of time-limited benefits is equivalent to the official send you a month of advanced membership, take the professional resources to practice and optimize their own trading system. Remember to click Recommended Links Complete registration to enjoy this exclusive offer.
Together, we will learn to use data-driven trading to go further in the crypto market!
Recent Recent Posts:
2026 Latest 6 Free Coin Ring Tools Inventory|Where to find the data on the chain?
2025 Latest OKX Web3 Wallet Tutorial: Does it work? How to create it? A Guide to Safe Operation, Multi-Link Support, and Time-Limited Airdrops
2026 Latest Polymarket Tutorial|How to find out the insiders and realize the high win rate!
2025 New DeFi Beginner's Guide|Teaching you to earn stable money passive income! Introducing 3 popular programs, DeFiLlama tool tutorial!
Disclaimer
The content of this article is for reference only, investors should exercise independent judgment, invest prudently and at their own risk, this article does not provide or attempt to persuade the audience to do trading or investment basis, the content is for sharing purposes only, and should not be regarded as investment advice.It does not represent the views and position of Monsterblockhk.All information and opinions are current as of the date of the judgment. In addition, if a judgment is rendered on aIn this siteAny content related to virtual asset trading platforms that have not yet obtained a license to operate virtual asset trading platforms in Hong Kong, including but not limited to text introductions, pictures, offers, events, etc., are only available to users outside the Hong Kong Special Administrative Region.
According to the Hong Kong Anti-Money Laundering and Counter-Terrorist Financing (Amendment) Ordinance 2022, after June 1, 2023, all centralized virtual asset trading platforms operating in Hong Kong or actively promoting their services to Hong Kong investors will be licensed and regulated by the SFC, and any related unlicensed activities will be a criminal offence. For more information and details of the legislation, users may refer to the SFC website.